

 The Ultimate Bigbull Ribbon Strategy: Complete Guide for XAUUSD & Forex Trading
Welcome to the ultimate masterclass on one of the most visually intuitive and highly effective trading strategies available for MetaTrader 5 (MT5). If you have been struggling to find a balance between trend-following, momentum, and key market levels, you are in the right place.
This guide breaks down a premium custom MT5 setup—featuring the Bigbull Ribbon system, Dynamic Support/Resistance zones, and the Spartan Spears oscillator. We will cover everything from entry and exit rules, Stop Loss (SL) and Take Profit (TP) placement, risk management, and how to navigate volatile news events.
By the end of this guide, you will have a clear, step-by-step blueprint for executing this strategy, along with the direct download link to install it on your own platform.
1. Nature and Brief History of the Indicator Setup
Before we dive into the rules, it is crucial to understand what you are trading and why it works. This setup is not a single indicator; it is a confluence of three major trading concepts: Trend, Structure, and Momentum.
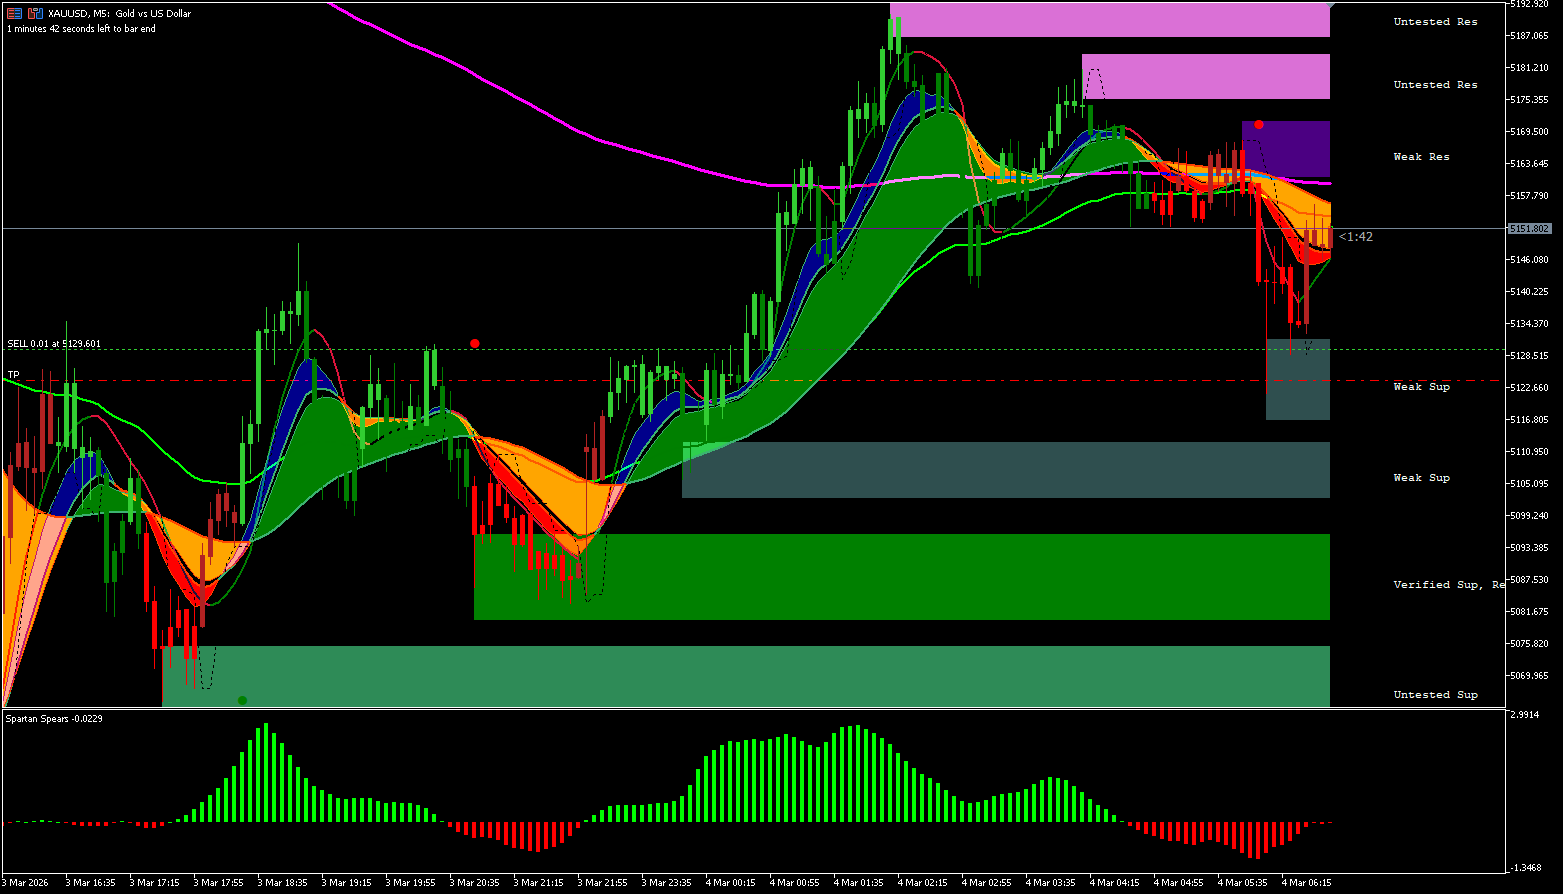
The Ancestry of Moving Average Ribbons
The core of this strategy revolves around the colorful ribbons mapping the price action. This concept stems from the Guppy Multiple Moving Average (GMMA), developed by Australian trader Daryl Guppy in the 1990s. The original GMMA used two groups of exponential moving averages (short-term and long-term) to show the relationship between retail speculators and institutional investors.
The "Bigbull Ribbon" custom indicators in this setup are a modern, smoothed evolution of that concept. They change color (Green for Bullish, Red/Orange for Bearish, Blue for transitional phases) to give you an instant visual cue of the trend's health.
Dynamic Supply and Demand (Support & Resistance)
On the right side of the chart, you will see shaded boxes labeled "Untested Res," "Weak Sup," and "Verified Sup." This draws from the rich history of Supply and Demand trading popularized by institutional traders. Instead of drawing manual lines that become outdated, this indicator automatically plots historical liquidity pools. It tells you exactly where buyers and sellers are waiting.
Momentum via the Spartan Spears Oscillator
At the bottom of the chart is the Spartan Spears indicator. This is an advanced histogram oscillator. Much like the classic MACD (Moving Average Convergence Divergence) created by Gerald Appel in the late 1970s, it measures the speed and momentum of the price. Green spikes mean buyers are accelerating; red spikes mean sellers are taking control.
2. Core Components: Anatomy of the Chart
To trade this strategy effectively, you need to understand the four primary visual elements on your screen:
-
The Trend Ribbons (Bigbull Ribbons): A thick band of moving averages. When the price is above a wide, green ribbon, we are in a strong uptrend. When the price is below a wide, red/orange ribbon, we are in a strong downtrend. Blue indicates a squeeze or market transition.
-
The Signal Dots: Small red or green dots that appear above or below the candles. These act as your early warning system and precise entry triggers.
-
The Spartan Spears (Bottom Window): The momentum histogram. You want this to agree with your ribbons. Green bars for buys, red bars for sells.
-
Dynamic S/R Zones: Shaded blocks that act as our targets (Take Profit) or safety nets (Stop Loss).
3. Recommended Pairs, Timeframes, and Account Balance
Which Pairs Should You Trade?
This strategy thrives on assets with high liquidity and clear trend behavior.
-
Primary Focus: XAUUSD (Gold). Gold trends beautifully and respects dynamic support and resistance levels with incredible accuracy.
-
Major Forex Pairs: EURUSD, GBPUSD, USDJPY, AUDUSD.
-
Avoid: Low liquidity exotic pairs (e.g., USDZAR, EURTRY) as spread costs and erratic spikes can ruin the ribbon structures.
Timeframes
The setup shown is on the M5 (5-minute) chart, making it an excellent Day Trading / Scalping strategy. You can also use it on the M15 or H1 for swing trading.
Initial Balance
Because we are trading XAUUSD (Gold) on a 5-minute timeframe, gold can be highly volatile.
-
Recommended Minimum Balance: $500 to $1,000 for trading micro-lots (0.01).
-
Ideal Balance: $2,000+ allows you to comfortably scale in and out of trades without risking margin calls during normal market breathing.
4. Risk Management: Fixed Lot Size vs. Percentage Ratio
Risk management is the difference between a professional trader and a gambler.
Fixed Lot Size vs. Percentage Risk
Many beginners ask if they should trade a fixed lot (e.g., always 0.05 lots) or a percentage of their account (e.g., 1% per trade).
-
Fixed Lot Size: Easy to calculate, but highly flawed. A 30-pip stop loss with a 0.05 lot size costs $15. A 100-pip stop loss with a 0.05 lot size costs $50. Your risk is wildly inconsistent from trade to trade.
-
Percentage Risk (Highly Recommended): You should risk a fixed percentage of your account on every trade—ideally 1% to 2% max. If you have a $5,000 account, your maximum risk per trade is $50. You adjust your lot size based on how far away your Stop Loss is.
The Risk/Reward Ratio (R:R) Never take a trade unless the potential reward is greater than the risk. The absolute minimum standard for this strategy is 1:1.5, meaning you risk $50 to make $75. Ideally, look for setups that offer a 1:2 or 1:3 ratio, targeting the next major Support/Resistance zone.
5. The Strategy Rules: Entries, SL, and TP
The BUY (Long) Setup
-
The Ribbon: The Bigbull Ribbon must be clearly GREEN and expanding.
-
The Signal: Wait for a Green Dot to appear below a candle.
-
The Momentum: Look down at the Spartan Spears. The histogram must be printing GREEN bars above the zero line.
-
The Structure: Ensure you are bouncing off a "Verified Support" or "Untested Support" zone. Do not buy if the price is immediately hitting a heavy Resistance zone.
The SELL (Short) Setup
-
The Ribbon: The Bigbull Ribbon must be clearly RED or ORANGE and expanding.
-
The Signal: Wait for a Red Dot to appear above a candle.
-
The Momentum: Look down at the Spartan Spears. The histogram must be printing RED bars below the zero line.
-
The Structure: Ensure price has rejected off a "Weak Res" or "Untested Res" zone.
Stop Loss (SL) Placement
Your Stop Loss is non-negotiable. It protects your capital.
-
Aggressive SL: Place it just above the signal dot (for sells) or below the signal dot (for buys).
-
Conservative SL (Recommended): Place it just outside the nearest dynamic Support/Resistance zone or entirely on the opposite side of the thick Bigbull Ribbon. If the ribbon flips, your trade idea is invalidated anyway.
Take Profit (TP) Placement
-
TP 1: Target the closest dynamic level (e.g., if buying, target the first "Weak Res" or "Untested Res" block). Take 50% of your profits off the table here.
-
TP 2: Let the rest run to the next major zone (e.g., "Verified Res") or until the Spartan Spears oscillator starts changing color (e.g., from green to red).
6. Advanced Trade Management
How to Use a Trailing Stop
Because this strategy captures large trends, a trailing stop is your best friend. Once your trade is in profit and hits TP1, move your Stop Loss to Break-Even (your entry price). From there, trail your stop loss right behind the Bigbull Ribbon. As the ribbon moves down in a sell trade, keep moving your SL down along the top edge of the ribbon. Let the market take you out when the trend finally bends!
The "Skip Signal" Scenario (When NOT to trade)
You will see dots appear that you absolutely must ignore. Skip the signal if:
-
Conflicting Colors: A green buy dot appears, but the Ribbon is thick red, and the Spartan Spears are red. This is a false reversal. Do not trade against the ribbon.
-
The Ribbon Squeeze: When the ribbon turns blue and shrinks into a very thin, flat line, the market is ranging. Skip all dot signals until the ribbon expands again.
-
Trading right into a Wall: A buy signal prints, but the price is 2 pips away from a massive "Untested Res" box. The risk-to-reward ratio is terrible. Skip it.
Where to Trade Again (Re-entries)
If you missed the initial breakout, wait for a pullback. The price will often retrace back into the thick part of the Ribbon (which acts as dynamic support/resistance). If the price touches the ribbon, rejects it, and prints a new dot in the direction of the trend, this is a prime re-entry spot!
When to Stop Trading for the Day
-
The 3-Strike Rule: If you take 3 consecutive losses, close your charts. The market is likely in an erratic, unpredictable phase that doesn't suit the strategy.
-
Daily Goal Hit: If you secure your target percentage (e.g., 2% to 4% growth in a day), secure your profits and walk away. Overtrading is the enemy of this strategy.
7. Market Environment: News and Trading Hours
News Trading Impact
Do NOT trade this strategy during major High-Impact News releases. Events like Non-Farm Payrolls (NFP), CPI data, or FOMC interest rate decisions inject massive algorithmic volatility into the market. Spreads widen, and price can spike 100 pips in both directions within seconds, blowing past your stop loss (due to slippage) and ignoring the ribbons entirely.
-
The Rule: Close all open day trades 15 minutes before a major red-folder news event. Wait until 15-30 minutes after the news to see where the real trend establishes itself.
Trading Hours Impact (The Killzones)
Not all hours of the day are created equal. This strategy relies on volume and momentum to push the price through the ribbons and hit your targets.
-
Best Times: The London Session (starts 8:00 AM GMT) and the New York Session (starts 1:00 PM GMT). The overlap between London and New York (1:00 PM to 4:00 PM GMT) is the "Golden Window" for XAUUSD.
-
Worst Times: The late Asian session right before London opens, or the dead zone after the New York close. The market often consolidates, leading to false signals and "blue ribbon" ranges.
Conclusion
The Bigbull Ribbon strategy combined with the Spartan Spears and Dynamic S/R zones is an incredibly powerful MT5 toolkit. By aligning the overall trend (Ribbons), precise timing (Dots), momentum (Spears), and market structure (S/R Zones), you put the statistical edge firmly in your favor.
Remember, no indicator is a magic wand. Always use strict percentage-based risk management, never trade into immediate resistance, and avoid high-impact news. Stick to the rules, master your psychology, and let the strategy do the heavy lifting.
Download the Strategy Files Below!
Ready to install this on your MT5 platform? Click the button below to download the complete zip file containing the indicators and template.