

The Ultimate 3 Parabolic Strategy Guide: Master Trend Trading and Manage Risk Like a Pro
Welcome to the definitive guide on mastering one of the most visually intuitive and powerful trend-following setups in Forex trading: The 3 Parabolic System.
If you have ever stared at a chart and felt overwhelmed by the noise, wondering exactly when a trend is actually starting or when it’s just a fakeout, you are not alone. Many traders struggle with timing their entries and, more importantly, timing their exits.
In this masterclass, we are breaking down a visual, step-by-step strategy based on the 3 Parabolic Indicator setup. We will cover the nature of the indicator, exact rules for Take Profits (TP) and Stop Losses (SL), how to handle major news events, and the ultimate debate: Fixed Lot Sizes vs. Percentage Risk.
Grab your notebook, open your MetaTrader terminal, and let's dive in!
1. The Nature and Brief History of the Parabolic Setup
Before we talk about the "3 Parabolic System," we need to understand its grandfather: the Parabolic SAR (Stop and Reverse).
Invented in 1978 by J. Welles Wilder Jr. (the legendary technical analyst who also created the RSI and the ATR), the Parabolic SAR was designed to highlight the direction of an asset's trend and provide precise exit points. Visually, it prints a series of dots above or below the price candles.
-
Dots below the candles: Bullish trend (Uptrend).
-
Dots above the candles: Bearish trend (Downtrend).
So, what is the 3 Parabolic System? Standard Parabolic SAR can sometimes give false signals (whipsaws) in a sideways, choppy market. The 3 Parabolic System solves this by layering multiple parameters or timeframes on top of each other.
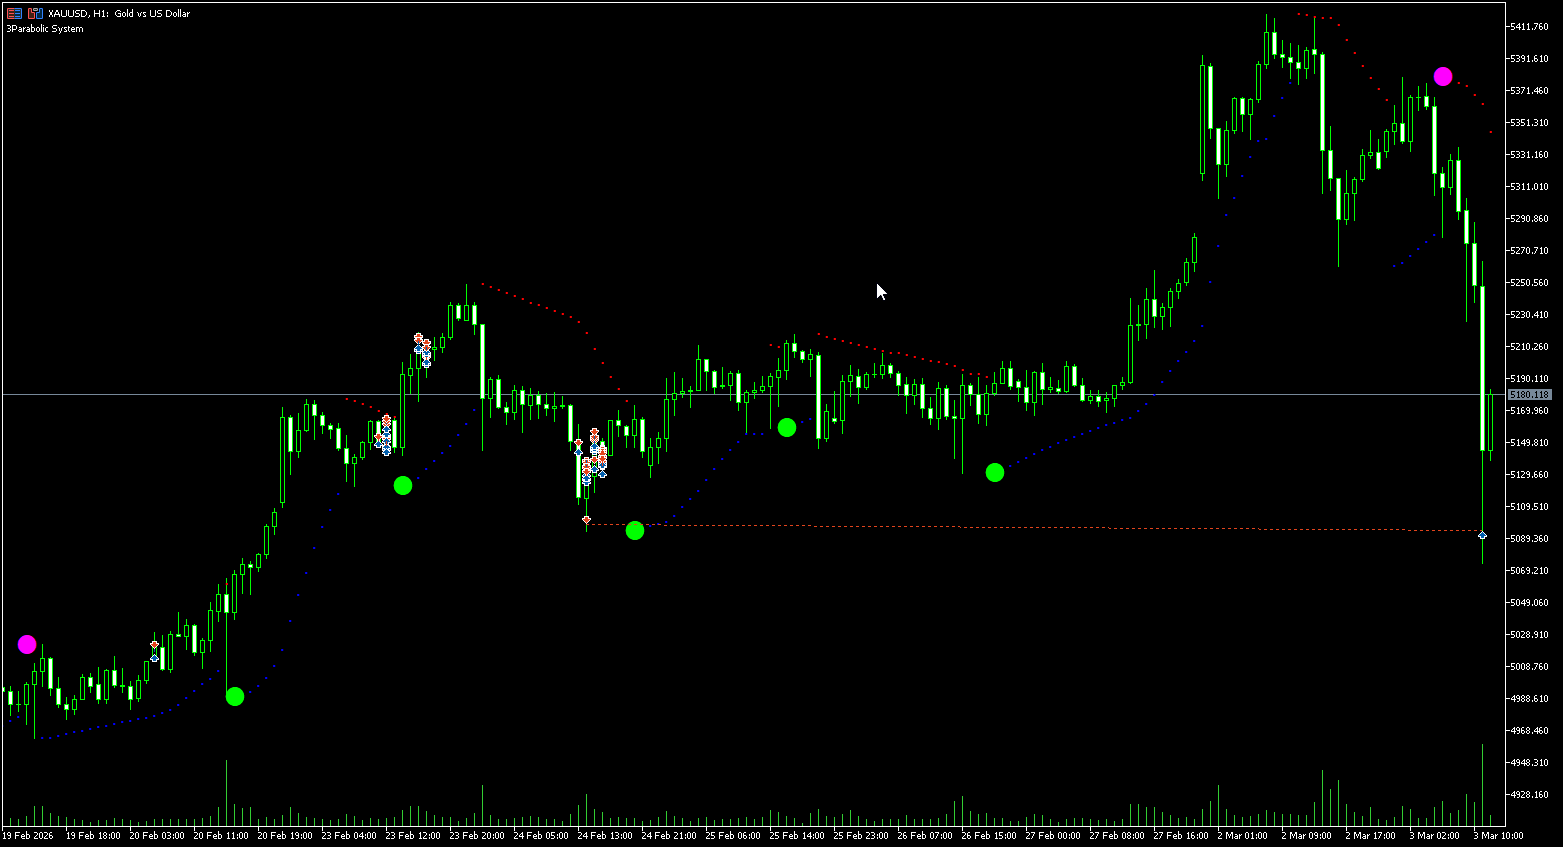
In your setup, you will notice:
-
Macro Trend Markers (The Big Circles): Large Green circles indicate a major shift to bullish momentum, while large Pink/Magenta circles indicate a major shift to bearish momentum.
-
Micro Trend / Trailing Markers (The Small Dotted Lines): The smaller blue (support) and red (resistance) dots hug the price action closer, giving you immediate feedback on short-term momentum.
-
Entry Arrows/Diamonds: Tiny visual cues that trigger when all conditions align, giving you a precise moment to pull the trigger.
By combining these layers, the indicator filters out the "noise" and only signals a strong trade when the short-term momentum aligns with the long-term trend.
2. Best Pairs to Trade With This Strategy
This system thrives in trending markets. It is a momentum-based strategy, meaning it performs poorly in flat, low-volume consolidation but prints fantastic results when a market picks a direction and runs.
Highly Recommended Pairs:
-
XAU/USD (Gold): Gold is notorious for explosive, long-lasting trends. This indicator is phenomenal for catching large moves on Gold, especially on the H1 (1-Hour) timeframe.
-
GBP/JPY & GBP/USD: The British Pound pairs are highly volatile and tend to trend beautifully.
-
EUR/USD: Excellent for reliable trends during the London and New York sessions.
Note: For the best results, stick to timeframes like the H1 (1-Hour) for day trading/swing trading, or M15 (15-Minute) if you prefer a slightly faster scalping approach.
3. The Rules of Engagement: How to Trade the System
Let’s keep this simple and strictly rule-based. Emotions have no place in a strategy this mechanical!
The BUY (Long) Setup
-
Macro Alignment: Wait for a Large Green Circle to appear below the price. This tells you the broader trend is now UP.
-
Micro Alignment: The smaller trailing dots must turn Blue and form below the candles.
-
The Trigger: Wait for a bullish candle to close above the blue dots, accompanied by the indicator's entry arrow/diamond. Enter on the open of the next candle.
The SELL (Short) Setup
-
Macro Alignment: Wait for a Large Pink/Magenta Circle to appear above the price. This tells you the broader trend is now DOWN.
-
Micro Alignment: The smaller trailing dots must turn Red and form above the candles.
-
The Trigger: Wait for a bearish candle to close below the red dots, accompanied by the indicator's entry arrow/diamond. Enter on the open of the next candle.
4. SL, TP, and the Power of the Trailing Stop
The absolute biggest mistake traders make is letting a losing trade run forever. Let's lock down your risk.
Stop Loss (SL) Placement
Your Stop Loss must always be placed at a level that invalidates your trade idea.
-
For a Buy: Place your SL just below the most recent Large Green Circle, or safely below the lowest point of the recent Blue dotted line.
-
For a Sell: Place your SL just above the most recent Large Pink Circle, or above the highest point of the recent Red dotted line.
Take Profit (TP)
There are two ways to take profit with this system:
-
Fixed Risk-to-Reward (R:R): Set a hard TP at a 1:1.5 or 1:2 ratio. For example, if your Stop Loss is risking $50, your Take Profit is set to make $75 or $100.
-
The Trailing Stop Method (Recommended for Maximum Profits): Since this is a trend-following system, why cut your profits short? Instead of a fixed TP, move your Stop Loss manually (or use your platform's trailing stop feature) to follow the small red/blue dots. As the blue dots move up during a buy trade, keep moving your SL just below them. You only exit the trade when the price eventually reverses and hits your trailing SL in profit.
5. Skip Signal Scenarios (When NOT to Trade)
No indicator is 100% perfect. You must learn when to sit on your hands. Skip the signal if you see the following:
-
The Choppy Market (Ranging): If the price is trapped in a tight horizontal box, and the large Green and Pink circles are rapidly alternating back and forth without the price actually going anywhere, stay out. The market is consolidating. Wait for a clear breakout.
-
Overextended Price: If the indicator gives a Buy signal, but the current price candle is incredibly far away from the blue dots (a massive, sudden spike), do not chase it. The risk is too high. Wait for a pullback.
-
Contradictory Timeframes: If you are trading the H1 timeframe, take a quick look at the Daily or H4 chart. If the H4 chart is showing massive downward momentum (Giant Pink circles), you might want to skip taking small Buy signals on the H1. Trade with the higher timeframe trend!
6. When to Trade Again & When to Stop New Trading
Knowing when to walk away from your screen is the hallmark of a professional trader.
When to Trade Again (Re-entries): If you get stopped out in profit via your trailing stop, but the overall trend remains intact (e.g., the large Green circle is still valid), you can look to enter again after a minor pullback. Wait for price to touch the blue dotted line and bounce off it, forming a new bullish candle.
When to STOP Trading for the Day:
-
The 2-Loss Rule: If you take two consecutive losses in a single day, shut down your terminal. The market conditions are likely choppy, or you are out of sync. Preserve your capital for tomorrow.
-
Daily Profit Goal Hit: If you have caught a massive 1:3 trend and hit your weekly goal in a single day, don't give it back to the market by overtrading.
7. The Impact of Trading Hours and News Events
The market does not move uniformly 24 hours a day. Volume is your best friend.
Trading Hours
This momentum strategy requires volume to push the price. The best times to trade this system are:
-
The London Session: Great volume and clear trend establishments.
-
The New York Session: The most volatile session.
-
The London/New York Overlap: This is the golden window for pairs like XAU/USD. The trend is usually strongest here.
-
Warning: Avoid trading during the late Asian session unless there is a specific catalyst. Markets are often too slow, resulting in false indicator signals.
News Trading Impact
Do not try to trade major news events with lagging indicators. High-impact news (like US CPI, NFP, or FOMC rate decisions) causes violent, unpredictable price spikes that will trigger both your SL and TP in milliseconds.
-
Rule: Check a Forex Economic Calendar daily. Pause all trading 30 minutes before a "Red Folder" news event, and wait 30 minutes after the news release for the market to choose a clear direction before re-applying the 3 Parabolic strategy.
8. Money Management: Balance, Risk, and Lot Sizes
Let’s talk numbers. How should you fund your account, and how do you calculate your risk?
Initial Balance
While some brokers allow you to start with $50, realistically, to practice proper risk management without stressing over micro-cents, an initial balance of $500 to $1,000 is recommended. This allows you enough breathing room to absorb a few losses while still taking meaningful trades.
Fixed Lot Size vs. Percentage Ratio
This is the most important concept in this entire guide.
Fixed Lot Sizing (Not Recommended for Beginners): Trading a fixed lot (e.g., always trading 0.05 lots) regardless of the setup is dangerous. Why? Because the distance to your Stop Loss changes with every single trade. If your SL is 20 pips away on Trade A, 0.05 lots might risk $10. If your SL is 60 pips away on Trade B, that same 0.05 lot risks $30. Your risk is inconsistent.
Percentage Ratio Sizing (Highly Recommended): Professional traders risk a strict percentage of their total account balance on every single trade—usually 1% to 2%.
-
If you have a $1,000 account, a 1% risk means you are willing to lose exactly $10 on a trade.
-
You measure the distance from your entry to your Parabolic Stop Loss (let's say it's 40 pips).
-
You then calculate the exact lot size required so that those 40 pips equal exactly $10.
By using the Percentage method, a string of losses won't blow your account, and as your account grows, your position sizes naturally compound and grow with it!
Summary
The 3 Parabolic System is an outstanding visual tool to keep you on the right side of the market. Remember the golden rules:
-
Trade in the direction of the big circles.
-
Use the small dots to trail your stop loss and lock in profits.
-
Never risk more than 1-2% of your account per trade.
-
Avoid choppy markets and major news events.
Trading is a marathon, not a sprint. Take this strategy, load it up on a demo account, and practice managing your trailing stops until it becomes second nature!