
 The Ultimate Supertrend MACD Strategy: A Complete Guide to Trend Trading
Welcome to the ultimate guide on one of the most reliable and visually intuitive trading strategies available today: the Supertrend MACD Strategy.
If you have ever struggled with knowing exactly when a trend is starting, when to stay in a trade, or when to cut your losses, this strategy is built for you. We are going to combine three powerful, classic indicators into one simple rule-based system. By the end of this comprehensive guide, you will know exactly how to execute trades, manage your risk, and master the psychology behind this setup.
Let’s dive deep into how this setup works, its history, and the exact rules you need to follow for maximum success.
1. The Nature and History of the Setup Indicators
To trust a trading strategy, you must understand the tools powering it. This setup relies on a "Holy Trinity" of trend trading:
The Supertrend Indicator
-
Nature: The Supertrend is a trend-following indicator based on the Average True Range (ATR). It plots a single line on your chart that flips above or below the price. When it turns green and moves below the price, it signals an uptrend. When it turns red and moves above, it signals a downtrend.
-
Brief History: Created by Olivier Seban, the Supertrend was designed to eliminate the noise of minor price fluctuations. By using the ATR (which measures market volatility), the indicator dynamically adjusts itself. If the market gets crazy, the Supertrend gives the price more room to breathe, preventing premature stop-outs.
The Moving Average (The Baseline Filter)
-
Nature: In our setup, the yellow line acts as your "Baseline" (usually a 50-period or 100-period Exponential Moving Average - EMA). Its sole purpose is to tell you the major market direction.
-
Brief History: Moving averages are one of the oldest technical indicators, dating back to the early 20th century before computers even existed! Traders calculated them by hand to smooth out price data and find the "true" direction of the market.
The MACD (Moving Average Convergence Divergence)
-
Nature: The MACD sits at the bottom of your screen. It consists of a histogram (the green and red bars) and signal lines. It measures momentum. A trend might exist, but without momentum, the price won't move far.
-
Brief History: Developed by Gerald Appel in the late 1970s, MACD is legendary. It shows the relationship between two moving averages of prices. When the MACD histogram flips from negative to positive, it shows bullish momentum is taking over.
2. Best Currency Pairs and Timeframes
This strategy thrives in markets that trend heavily. Ranging or choppy markets will produce false signals.
-
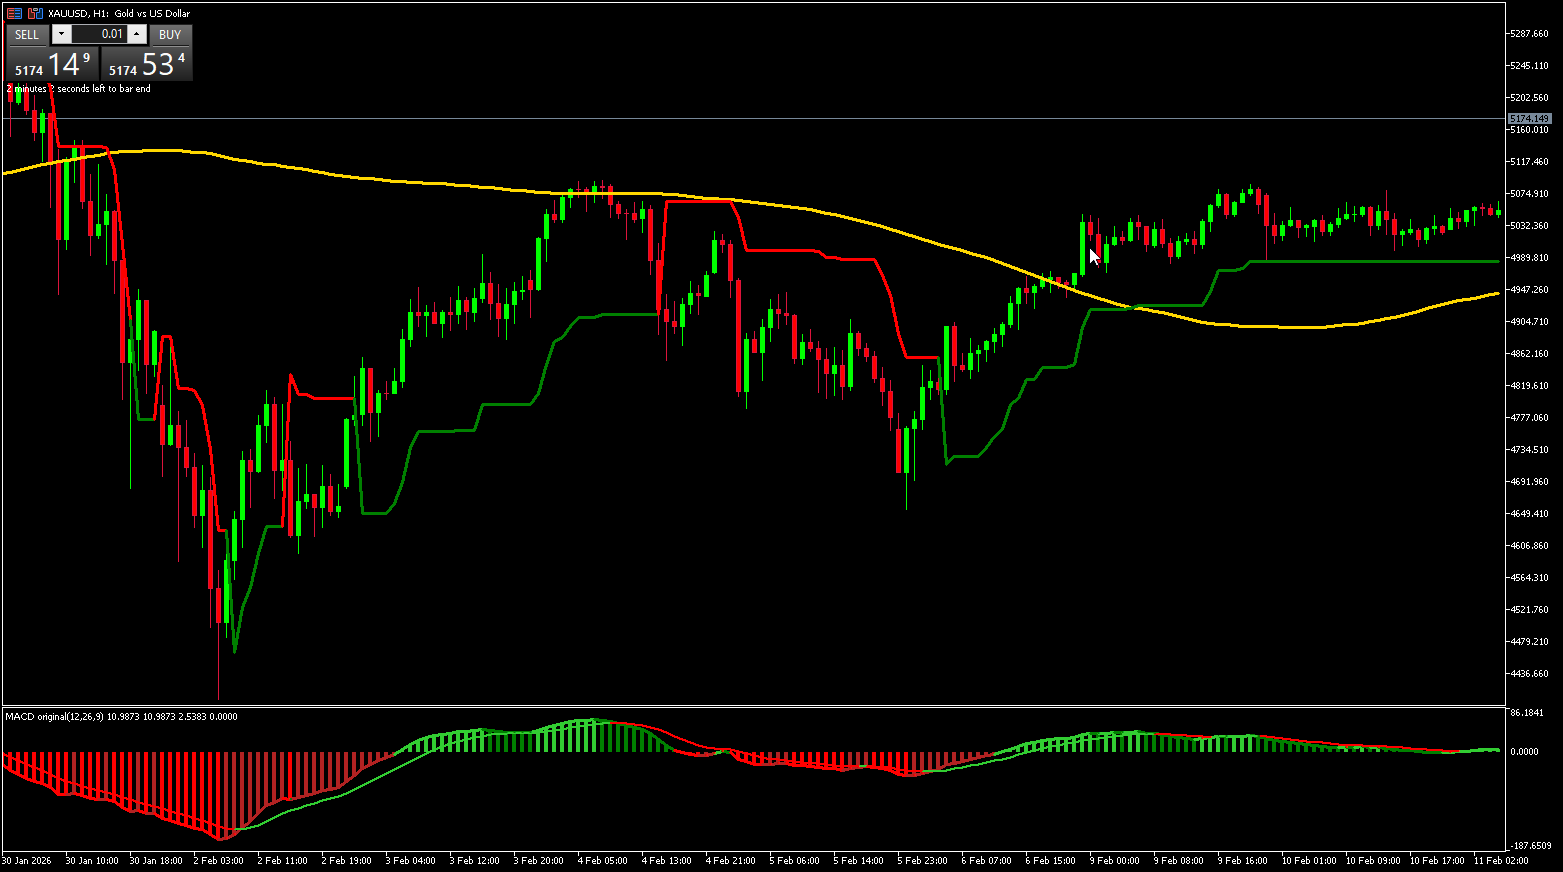
Best Asset Classes: Gold (XAUUSD) is the absolute king for this strategy because when Gold trends, it moves massively. Major currency pairs like EURUSD, GBPUSD, and USDJPY are also excellent.
-
Pairs to Avoid: Minor cross pairs with low liquidity (like EURCHF or AUDNZD) as they tend to chop around and lack clear momentum.
-
Best Timeframe: The 1-Hour (H1) timeframe (as shown in the setup) is highly recommended. It provides a perfect balance: it filters out the noisy "fakeouts" of the 5-minute charts, but gives you more trading opportunities than the Daily charts.
3. The Core Trading Rules
Trading should not be based on emotion; it should be based on a checklist. Here is your exact checklist for entering trades.
The BUY (Long) Scenario
You only look for a buy entry when ALL THREE of these conditions are met:
-
The MA Baseline: The current price candle must close above the yellow Moving Average line. This tells us the macro trend is UP.
-
The MACD: The MACD histogram must be green (above the zero line), indicating bullish momentum.
-
The Supertrend Trigger: The Supertrend indicator must flip to Green and step below the price candles.
-
Entry: Enter the trade at the opening of the next candle after all three conditions align.
The SELL (Short) Scenario
You only look for a sell entry when ALL THREE of these conditions are met:
-
The MA Baseline: The current price candle must close below the yellow Moving Average line. This tells us the macro trend is DOWN.
-
The MACD: The MACD histogram must be red (below the zero line), indicating bearish momentum.
-
The Supertrend Trigger: The Supertrend indicator must flip to Red and step above the price candles.
-
Entry: Enter the trade at the opening of the next candle after all three conditions align.
4. Skip Signal Scenarios (When NOT to Trade)
The difference between an amateur and a pro is knowing when to stay out of the market. You must SKIP the signal if:
-
The Baseline Conflict: The Supertrend turns green (Buy signal), but the price is still below the yellow Moving Average. Do not buy! Wait for the price to cross the baseline.
-
MACD Disagreement: The Supertrend gives a signal, but the MACD histogram is flat or on the wrong side of the zero line. This means there is no momentum. Skip the trade.
-
The Late Entry: If a massive, giant candle breaks the Moving Average and flips the Supertrend all at once, you might be entering too late. The move has already happened. It is better to skip and wait for a pullback.
5. Trade Management: TP, SL, and Trailing Stops
Once you are in a trade, how you manage it dictates your profitability.
Stop Loss (SL) Strategy
Never trade without a Stop Loss.
-
Initial SL: Place your exact Stop Loss directly on the Supertrend line at the time of your entry. If the trade immediately goes against you and the Supertrend flips color, your trade idea was wrong, and you exit safely.
Trailing Stop Strategy
This is where the Supertrend shines! Notice how the Supertrend looks like a staircase?
-
As the price moves in your favor, the Supertrend line will move with it (stepping up in a buy, stepping down in a sell).
-
Action: Manually move your Stop Loss to the new level of the Supertrend line every time it creates a new "step". This allows you to lock in profits while giving the trend room to run indefinitely.
Take Profit (TP) Strategy
You have two choices for taking profit:
-
Fixed Risk-to-Reward (R:R): Set a fixed Take Profit target at a 1:2 ratio. If your Stop Loss risks 20 pips, your Take Profit should be 40 pips.
-
Dynamic Exit (Recommended): Let the Trailing Stop do the work. Do not set a hard Take Profit. Stay in the trade until the price reverses enough to hit your trailing Supertrend line. This is how you catch those massive, 100+ pip home runs on Gold!
6. When to Trade Again and When to Stop
Where to Trade Again (Re-entry)
Let's say you caught a good trend, got stopped out in profit, but the major trend continues. How do you get back in?
-
Wait for a pullback. The price will often return to touch the yellow Moving Average.
-
If the price touches the MA, bounces off it, and the MACD + Supertrend align again in the direction of the main trend, you have a valid Re-entry signal.
When to Stop New Trading
Knowing when to close your laptop is crucial for your trading psychology. Stop trading for the day if:
-
You have taken 3 consecutive losing trades. The market is likely choppy, and your strategy is not suited for the current conditions. Come back tomorrow.
-
You have hit your daily profit goal. Greed is a trader's worst enemy.
-
It is late Friday evening. Never hold these day-trading positions over the weekend due to weekend market gap risks.
7. The Impact of News and Trading Hours
News Trading Impact
-
Rule: Do NOT trade 30 minutes before or 30 minutes after major "Red Folder" economic news (like US Non-Farm Payrolls (NFP), CPI inflation data, or Federal Reserve Interest Rate decisions).
-
Why? News events cause erratic, massive spikes in price that ignore technical analysis. These spikes will easily trigger false Supertrend signals and hit your Stop Loss due to high slippage. Let the news settle, then trade the real trend that forms afterward.
Trading Hours Impact
Volume is the fuel for trends.
-
Best Hours: Trade during the London Session and the New York Session. The highest probability setups occur during the overlap of these two sessions (approx. 8:00 AM to 12:00 PM EST).
-
Worst Hours: The late Asian session is notoriously slow. You will get many false signals during this time because there isn't enough trading volume to push the MACD and Supertrend into a sustained move.
8. Account Balance, Risk, and Money Management
A great strategy is useless with poor money management.
Recommended Initial Balance
While you can start with $100 on a micro account, a recommended starting balance for trading standard or mini lots comfortably on H1 timeframes is $500 to $1,000. This gives you enough margin to breathe and survive inevitable losing streaks.
Fixed Lot Size vs. Percentage Risk
Always use Percentage Risk, NEVER a fixed lot size.
-
Why Fixed Lots fail: If you always trade 0.10 lots, but one trade has a 10-pip Stop Loss and the next has a 50-pip Stop Loss, you are risking totally different amounts of money.
-
The Percentage Rule: Risk exactly 1% to 2% of your total account balance per trade.
-
How to do it: Measure the distance from your entry price to your Supertrend Stop Loss in pips. Use a free Forex Position Size Calculator online to determine exactly what lot size equals 1% of your account based on that pip distance.
Risk to Reward Ratio (R:R)
Always aim for a minimum of a 1:1.5 or 1:2 Risk to Reward Ratio. If you are risking $20 on a trade, your setup must realistically have the potential to make $30 to $40. Because this is a trend-following strategy with a trailing stop, your winning trades will often naturally exceed a 1:2 ratio!
Ready to Start Trading the Supertrend MACD Strategy?
Trading requires patience, discipline, and the right tools. By following the rules laid out in this ultimate guide—waiting for the Moving Average confirmation, checking the MACD momentum, and riding the Supertrend—you are putting the mathematical odds in your favor.
To make things easy for you, I have packaged the exact custom indicators and MT5 template used in this strategy guide. You can download the complete setup files below, install them into your MetaTrader platform, and start practicing on a demo account today!