

The Ultimate McROWEN Trend Killer Strategy Guide
Welcome to the definitive guide for one of the most visually intuitive and powerful trend-following systems available for MT4: the McROWEN Trend Killer. If you are looking for a strategy that simplifies price action and filters out market noise, you are in the right place.
Nature and History of the Setup
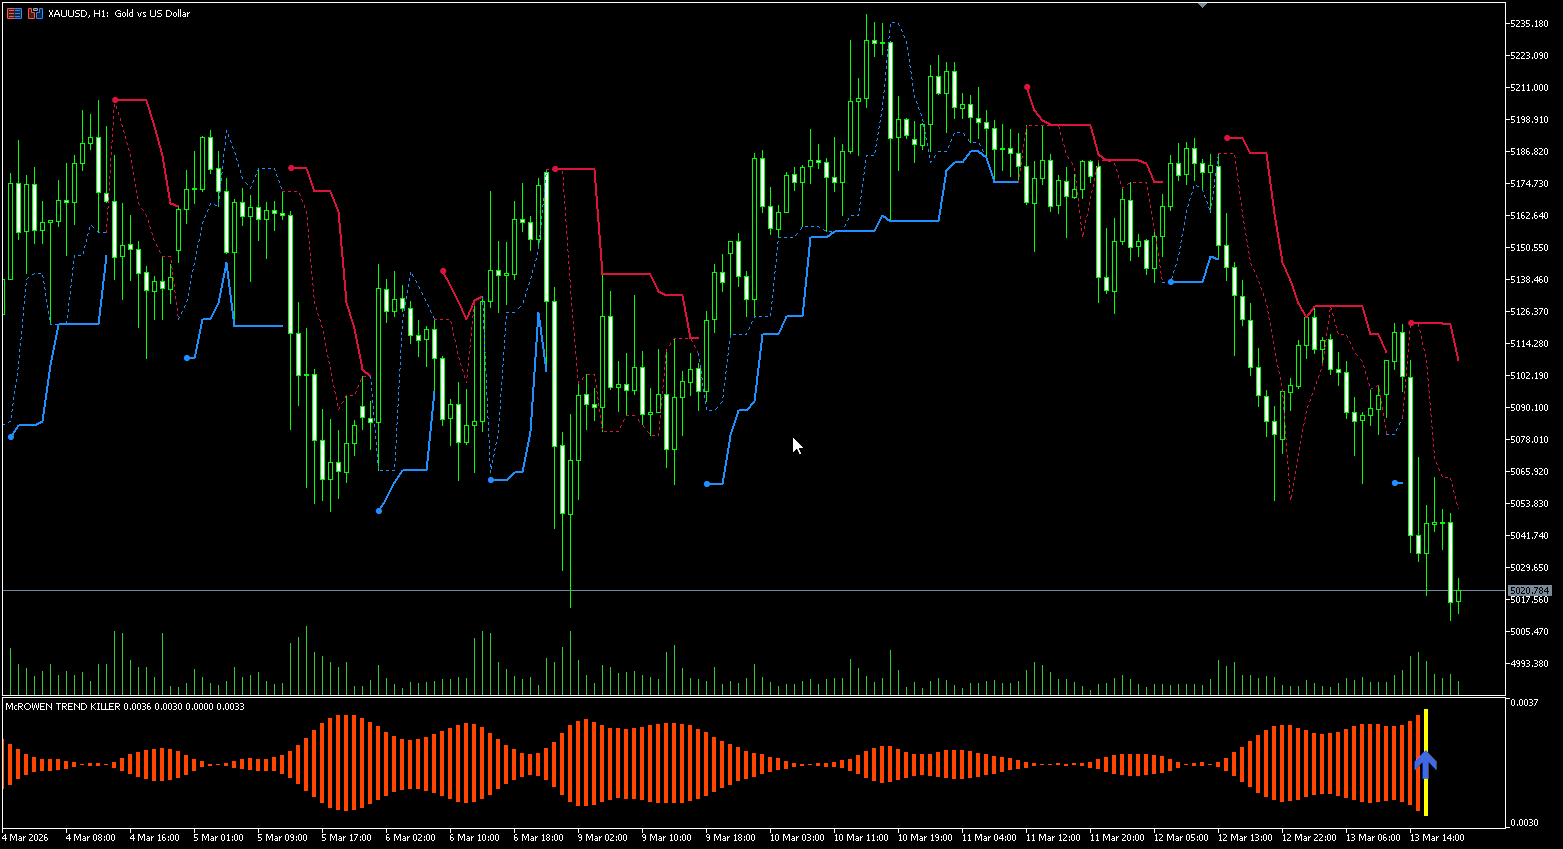
The McROWEN Trend Killer was designed with a single philosophy in mind: The trend is your friend until the end. Historically, trend-following indicators like Moving Averages or Parabolic SAR often suffer from "lag" or "whipsaw" in ranging markets. The McROWEN setup addresses this by combining a Price-Adaptive Volatility Band (the red and blue stepped lines on your main chart) with a Momentum Histogram (the McROWEN Trend Killer oscillator at the bottom).
This dual-layer confirmation ensures that you aren't just buying because the price is high, but because there is genuine institutional momentum behind the move.
Core Components of the Chart
-
The Trend Band (Main Chart): * Blue Line: Indicates a Bullish (Up) Trend.
-
Red Line: Indicates a Bearish (Down) Trend.
-
-
The Histogram (Sub-window):
-
Orange Bars: High momentum.
-
Blue Arrow: A specific signal trigger indicating a potential trend reversal or continuation.
-
Strategy Execution: Rules for Entry
1. Buy (Long) Scenario
-
The Main Chart indicator shifts from Red to Blue.
-
The McROWEN Histogram at the bottom is showing consistent bars above the zero line.
-
Ideally, a Blue Arrow appears on the histogram, confirming the surge in buying pressure.
-
Entry: At the close of the candle where the color shift and arrow align.
2. Sell (Short) Scenario
-
The Main Chart indicator shifts from Blue to Red.
-
The McROWEN Histogram bars are building momentum below the zero line.
-
Price is trading below the Red Trend Band.
-
Entry: At the close of the candle where all red signals align.
Managing the Trade: TP, SL, and Trailing
To survive in Forex, your exit strategy is more important than your entry.
-
Stop Loss (SL): Always place your SL 5–10 pips above the Red Band (for Sells) or below the Blue Band (for Buys). This uses the indicator’s volatility logic as a "natural" barrier.
-
Take Profit (TP): * Conservative: Aim for a 1:1.5 Risk-to-Reward ratio.
-
Aggressive: Aim for 1:3 or wait for the Trend Band to change color.
-
-
Trailing Stop: This is the secret sauce for this strategy. As the "stepped" line moves with the price, manually move your SL to the next "step" of the indicator. This locks in profit while giving the trade room to breathe.
When to Skip Signals (The "No-Trade" Zone)
Not every signal is a winner. You must SKIP the trade if:
-
The Band is Flat: If the red/blue lines are horizontal for a long period, the market is ranging. Wait for a clear slope.
-
Divergence: If the price is making a new high but the McROWEN Histogram is making a lower high, the trend is exhausted.
-
Late Entry: If the price is already far away from the Band, do not chase the trade. Wait for a retest of the line.
Where to Trade Again? If you missed the initial breakout, wait for the price to pull back and touch the Blue/Red line without crossing it. This "retest" is often the safest entry point.
External Factors: News and Trading Hours
Trading Hours Impact
-
Best Time: The London/New York Overlap (13:00 – 17:00 GMT). This is when Gold (XAUUSD) has the highest volatility.
-
Avoid: The Asian session or late Friday night, as the "Trend Killer" needs volume to work. Flat markets will lead to false signals.
News Trading Impact
High-impact news (NFP, CPI, FOMC) can gap right through your Trend Bands.
-
Rule: Stop trading 30 minutes before "Red Folder" news.
-
Restart: Wait 15–30 minutes after the news release for the indicator to stabilize and show the new directional bias.
Recommended Pairs and Risk Management
-
Preferred Pairs: This specific setup is optimized for XAUUSD (Gold) on the H1 (1-Hour) timeframe. It also performs exceptionally well on volatile pairs like GBPJPY and EURUSD.
-
Initial Balance: Recommended minimum of $500.
-
Lot Size vs. Percentage: * Never use a fixed lot size (e.g., always 0.10).
-
Always use Percentage Risk. Risk only 1% to 2% of your total account balance per trade.
-
Pro Tip: Calculate your lot size based on the distance between your Entry and your Stop Loss using the formula:
$$Lot Size = \frac{Account Equity \times Risk \%}{Stop Loss Pips \times Pip Value}$$
Download Your Trading Tools
Ready to take your trading to the next level? Download the complete McROWEN Trend Killer indicator package and template below.
Summary Table for Quick Reference
| Feature | Requirement |
| Timeframe | H1 (Recommended) |
| Asset | Gold (XAUUSD), Major Pairs |
| Risk per Trade | 1% - 2% |
| Reward Ratio | 1:1.5 minimum |
| Best Hours | London & New York Sessions |