")

The Ultimate Gold Supply & Demand Strategy: A Complete Guide
In the world of Forex trading, "Cash is King," but "Context is Queen." If you want to trade like the big banks and institutional players, you must understand where they are buying and selling. This setup uses a professional Supply and Demand (S&D) Indicator to map out "Smart Money" zones where price is likely to reverse or explode.
Whether you are a beginner or a pro, this guide will break down every rule you need to follow to master this setup.
Nature and History of the Setup
Supply and Demand trading is the oldest and most reliable form of technical analysis. It is based on the economic law that when demand exceeds supply, prices rise, and when supply exceeds demand, prices fall.
This specific indicator setup is designed to automate the process of finding "bases" or "consolidation zones" before an impulsive move. Historically, these zones represent areas where institutional orders were left unfilled. When price returns to these zones, those orders get triggered, leading to high-probability trade setups.
Best Pairs and Timeframes
While this strategy works on most major pairs, it is highly optimized for Gold (XAUUSD).
-
Primary Pair: XAUUSD (Gold).
-
Secondary Pairs: EURUSD, GBPUSD, USDJPY.
-
Best Timeframes: * Higher Timeframe (HTF): H4 or D1 (To identify major zones).
-
Entry Timeframe (LTF): M15 or M5 (For sniper entries).
-
Trading Rules: The "Step-by-Step" Execution
1. Entry Conditions
-
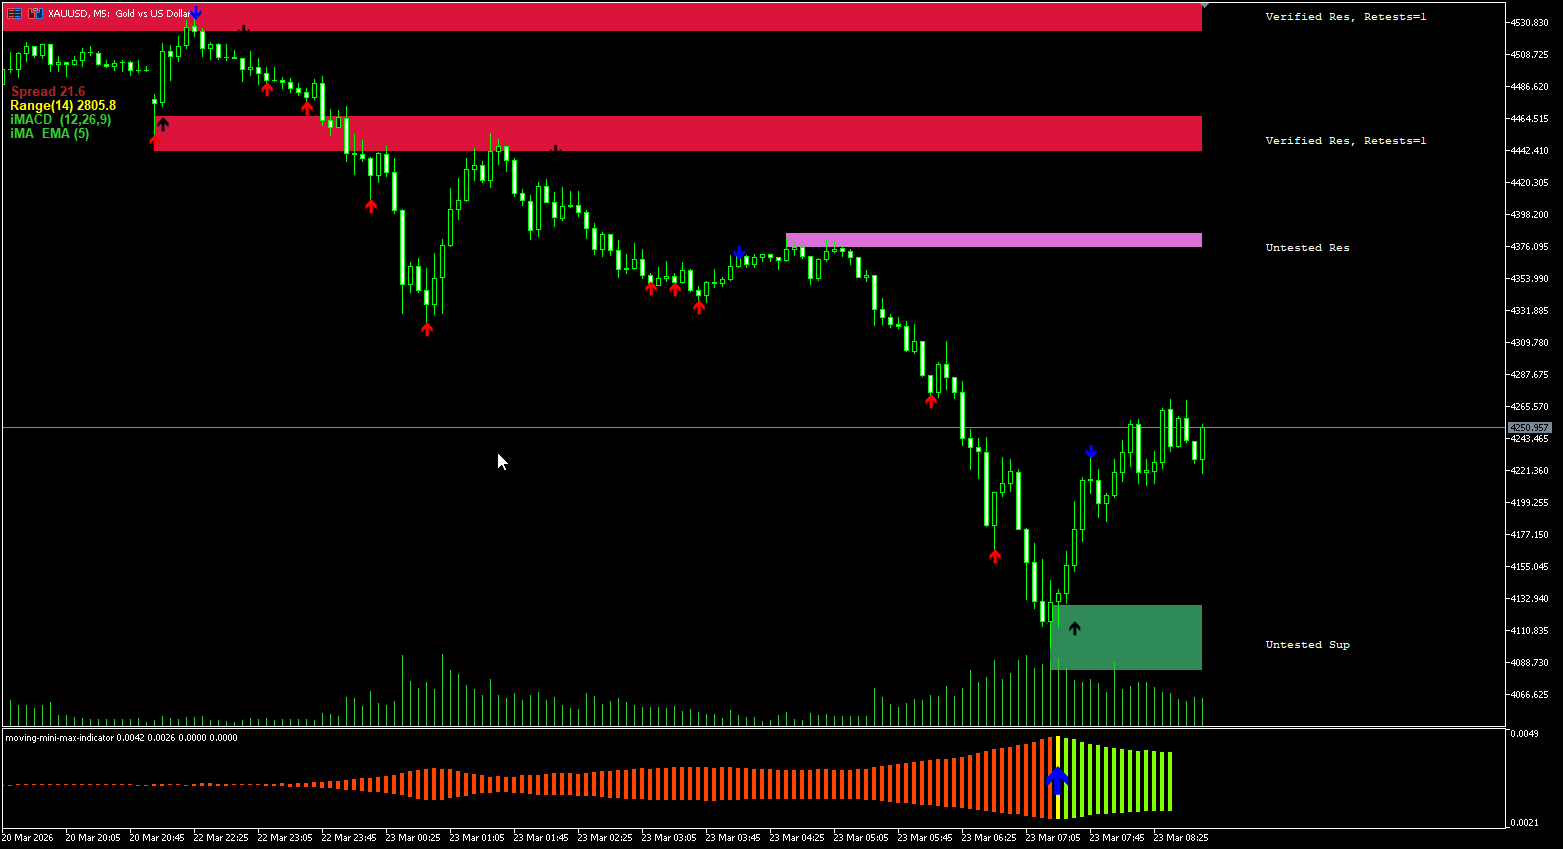
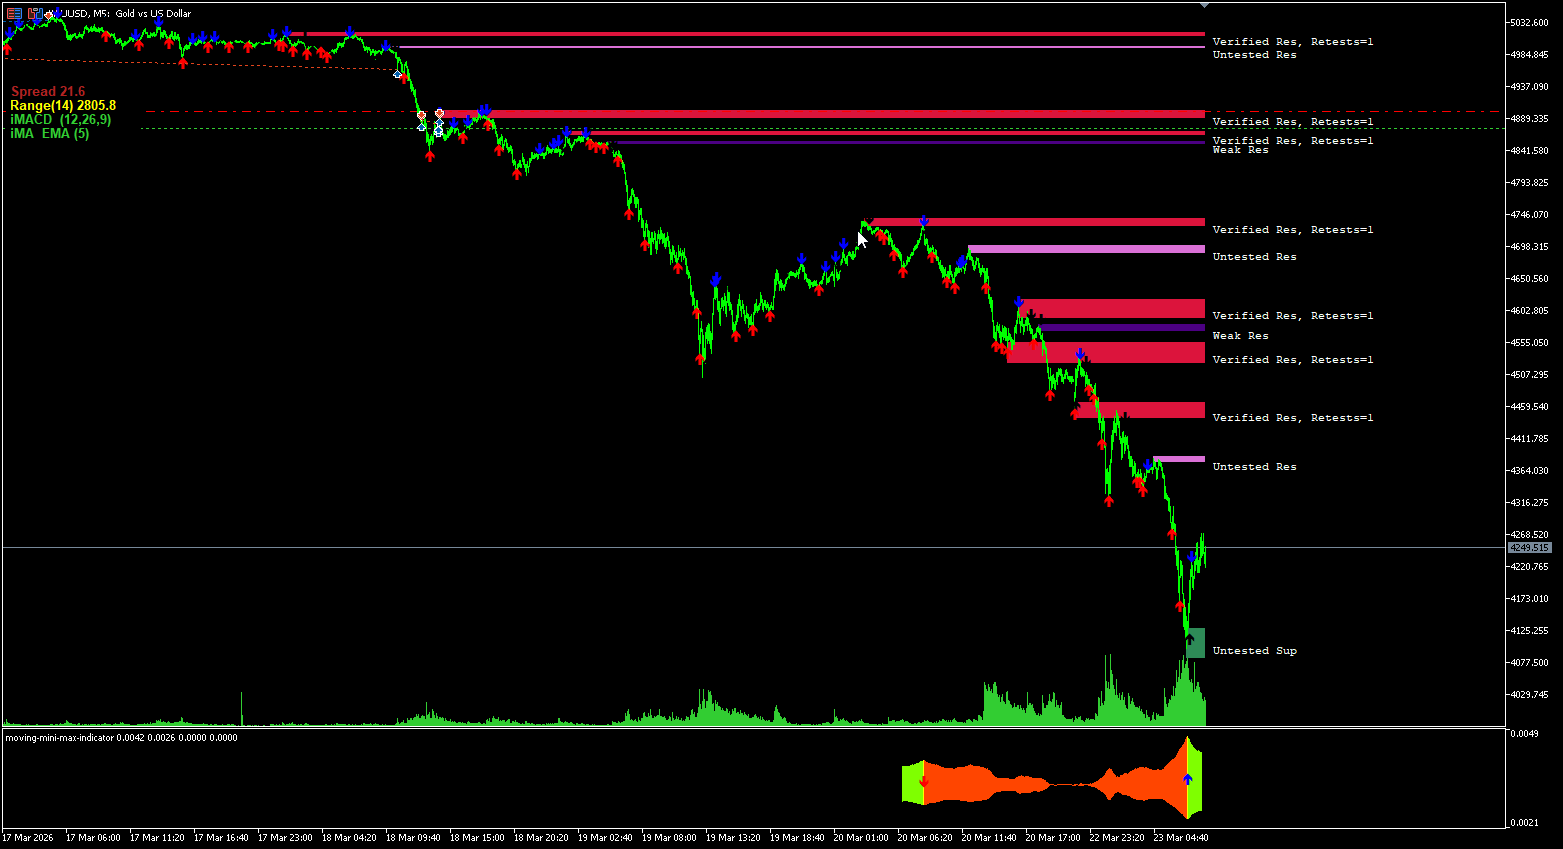
Buy Signal: Price enters a Demand Zone (usually Blue/Green) and an Up Arrow appears or price shows a bullish rejection (long wick).
-
Sell Signal: Price enters a Supply Zone (usually Red/Orange) and a Down Arrow appears or price shows a bearish rejection.
2. Take Profit (TP) and Stop Loss (SL)
Gold is volatile, so your levels must be logical:
-
Stop Loss (SL): Place your SL 5–10 pips outside the supply or demand zone. Do not put it right at the edge, as Gold often "hunts" liquidity just past the zone before reversing.
-
Take Profit (TP): Target the next opposing zone.
-
TP1: 1:2 Risk-to-Reward ratio.
-
TP2: The next major Supply/Demand zone on the chart.
-
3. Trailing Stop Strategy
Once the price reaches 1:1 Risk-to-Reward, move your Stop Loss to Break Even (BE). As price creates new "minor" levels on the M5 timeframe, trail your stop behind those recent swing highs or lows to lock in profit.
4. When to Skip a Signal (The "No-Trade" Scenario)
Not every arrow is a winner. Skip the trade if:
-
The zone has been "touched" more than 3 times (it becomes weak).
-
The zone is very "wide" (huge risk compared to potential reward).
-
A high-impact news event (NFP, CPI, FOMC) is happening within 30 minutes.
-
Price is moving sideways in a very tight "choppy" range.
5. Where to Trade Again?
If you get stopped out but the zone still holds, look for a "Second Chance Entry." This happens when price sweeps the initial stop loss, returns inside the zone, and gives a second arrow or a strong engulfing candle.
Market Impact: Timing Your Trades
Trading Hours Impact
The time of day is crucial for Gold.
-
London Session (07:00 – 11:00 GMT): Best for identifying the initial daily trend.
-
New York Session (13:00 – 17:00 GMT): The most profitable time. This is when the highest volume occurs and Gold makes its biggest moves.
-
Asian Session: Usually sideways. Avoid trading unless you are a scalper.
News Trading Impact
Gold is extremely sensitive to USD news. During NFP (Non-Farm Payrolls) or CPI (Inflation) data, Gold can move 200–500 pips in seconds.
Golden Rule: Never enter a new trade 15 minutes before or after "Red Folder" news. Let the market settle, then trade the "Retest" of the zone created by the news.
Risk Management & Account Setup
Initial Balance
-
Minimum Recommended: $200 (using 0.01 micro lots).
-
Ideal Balance: $1,000+ for proper compounding.
Risk-to-Reward (RR) Ratio
-
Aim for a minimum of 1:2.
-
This means if you risk $10, you should aim to make at least $20. This allows you to be profitable even if you only win 40% of your trades.
Fixed Lot vs. Percentage Risk
-
Recommendation: Use Percentage Risk (1% to 2% per trade).
-
Why? Fixed lot sizes don't account for your growing (or shrinking) balance. By risking 1%, you survive losing streaks and maximize gains during winning streaks.